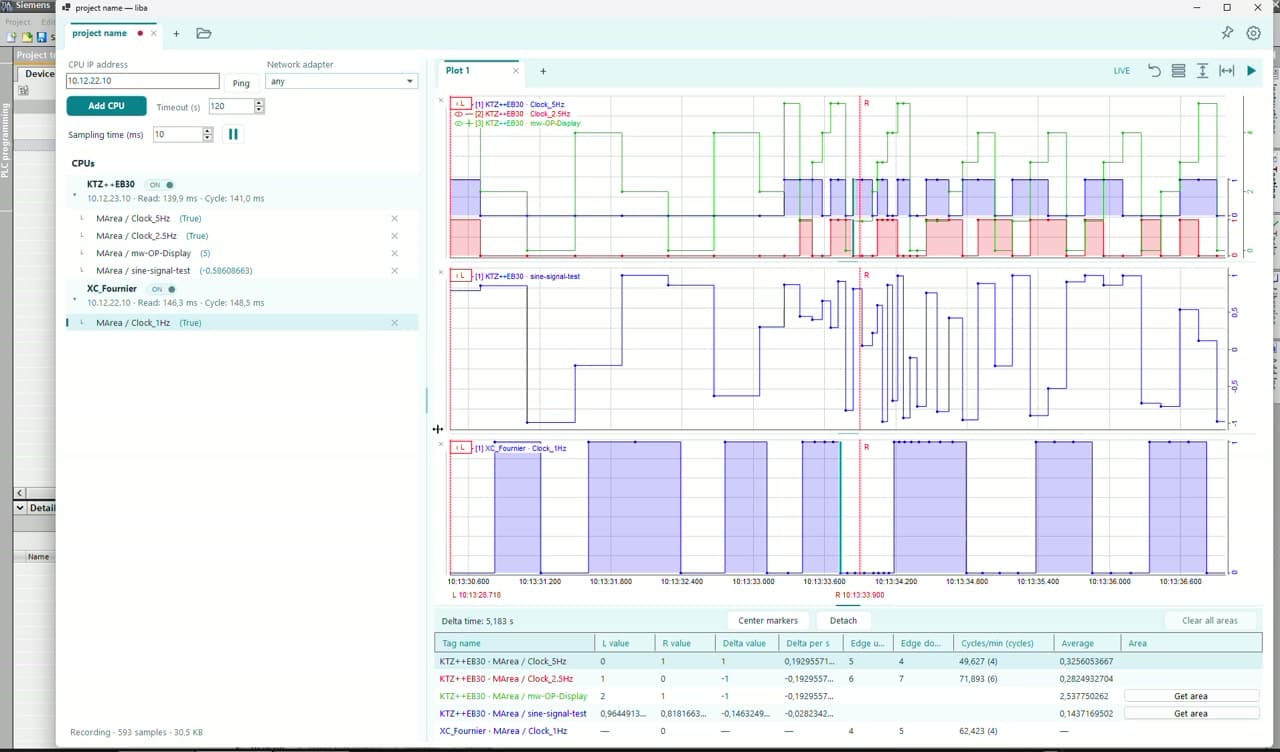
Record across multiple projects and CPUs, with acquisition times below 10 ms on suitable setups. Drag and drop signals from TIA Portal, review old recordings and explore the full data analysis workspace.
On suitable setups. Timing depends on CPU, connection and signal selection.
The workflow, at a glance
Multiple projects.
One clear overview.
Working across several machines means keeping track of projects, PLCs and recordings at the same time. NidoScope keeps each project organised so you can record in parallel, switch your view and investigate older captures without losing the overview.
→
01Select signals
Browse symbols or drag from TIA
→
02Record in parallel
Multiple projects · multiple PLCs
→
03Review recordings
Live overview · saved captures
Read-only monitoring with plots, markers, trigger conditions and exports. Acquisition timing depends on the CPU, connection and selected signals.
NidoScope in action
From the first signal to the full picture.
01 / Set up the workspace
Your projects. Your signals. One overview.
Keep each machine or task in its own project, with its CPUs, signals and plots together. Start with a CPU connection, discover its symbols and choose the signals you want to follow.
Multi-project support keeps separate workspaces and recording settings ready to use.
Connect a compatible CPU by IP address and browse its available signals.
Select numeric and Boolean signals, then arrange them on your plots. Switch project tabs while other recordings continue.
What you gain
A clear starting point for every project, without losing track of the others.
Bring signals directly from TIA Portal into NidoScope and watch them alongside the rest of your project. Multiple CPUs per project let you investigate related signals in one workspace.
Drag and drop a signal from TIA Portal onto the relevant CPU. NidoScope matches it to the CPU’s address book.
Add more CPUs to the same project and record their selected signals together.
Acquisition time <10 ms on suitable setups. Actual timing depends on the CPU, connection and selected signals; measured read and cycle times stay visible.
What you gain
Less signal entry and a shared view of what your connected CPUs are doing.
Move from the overall trend to the exact moments that matter. Compare signals on a shared timeline, position markers and inspect the values behind the plots.
Zoom into a selected interval and compare numeric and Boolean signals across CPUs.
Use left and right markers to measure elapsed time, signal values and differences.
Inspect the analysis table for rates of change, rising and falling edges, cycles, averages and area measurements.
What you gain
A detailed view of signal timing and behaviour, ready for troubleshooting and recording review.
Review old recordings. Pick up where you left off.
Reopen a saved recording without a live CPU connection. Return to its plots, compare signal values and use the analysis tools to investigate the sequence at your own pace.
Review earlier sessions while other projects continue recording. Merge completed sessions or export the results when you need to take the investigation further.
A few useful details
Questions, answered.
Can I record several projects and PLCs at the same time?+
Yes. NidoScope can record multiple projects and multiple compatible PLCs simultaneously. Start recording in each project; switching tabs keeps the other recordings running. Each project retains its own PLC selection, adapters and sampling settings.
Can I drag signals from TIA Portal into NidoScope?+
Yes. Drag one signal at a time from TIA Portal onto a PLC heading or one of its signal rows in NidoScope. NidoScope matches the signal against that PLC’s address book. A unique match is added automatically; multiple matches or no match open the tag picker with the dropped signal in the filter so you can choose, adjust the search or refresh the address book.
Does NidoScope write values to the PLC?+
No. NidoScope provides signal discovery, reading, recording and analysis. It has no PLC-value write controls.
Is the selected sampling interval guaranteed?+
The setting controls the requested interval. CPU response times and sequential read batches can make actual cycles longer. NidoScope displays measured read and cycle timings.
Can I inspect recordings away from the machine?+
Yes. Saved .libarec recordings open without a CPU connection. You can inspect plots and markers while other live projects continue recording.
Can the application be tailored to our requirements?+
Yes. The application can be tailored to your specific requirements. Describe your workflow and the adaptations you need in your quotation request so we can discuss the scope with you.
Let’s talk about your application
Built around your requirements.
NidoScope can be tailored to your specific requirements. Tell us about your workflow and the adaptations you need.